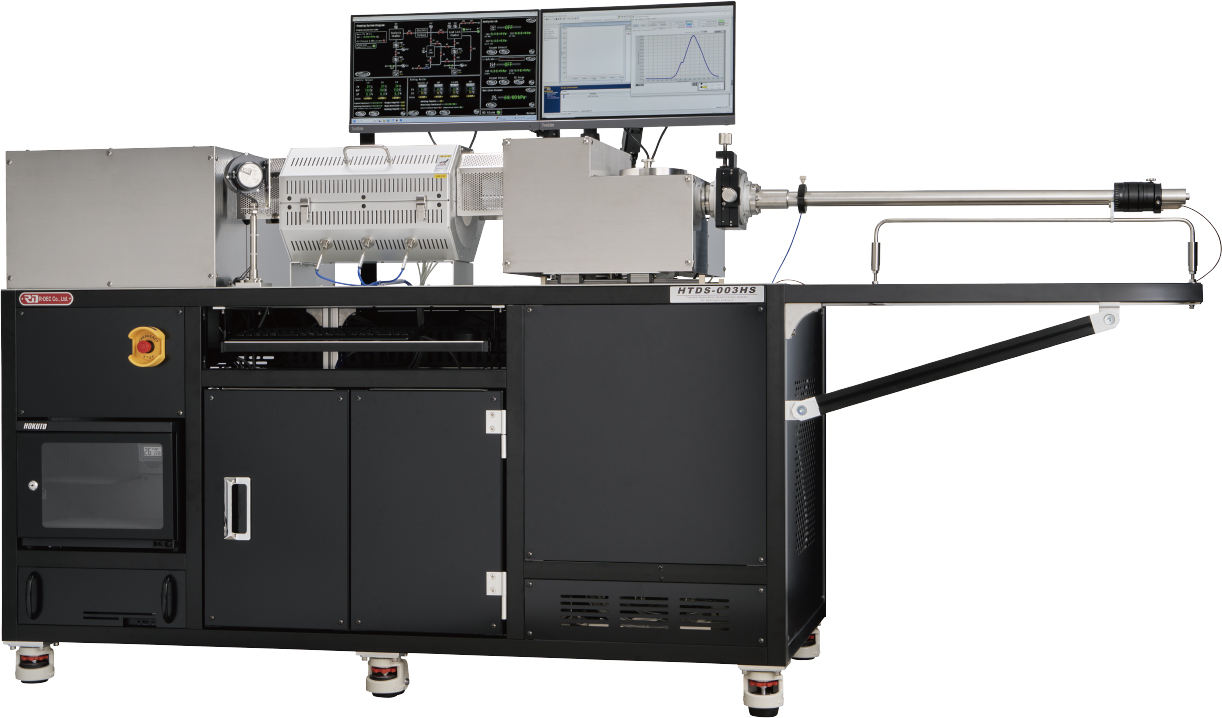
HTDS-003HS
Thermal Desorption Spectroscopy (TDS) System for Hydrogen
Product Information
■Joint Development with NIMS
Maintains the performance of the conventional HTDS-003 model with significantly improved operability via PC control.
■High-Sensitivity Quantitative Hydrogen Analysis
Capable of performing temperature-dependent analyses and quantitatively analyzing trace amounts of hydrogen in high-tensile steels, hydrogen storage alloys, and electronic components used in EVs.
■Improved Operability
The system enables PC-based operation of evacuation and heating controls through internally-developed software. Hydrogen quantitative calculation software “H2Cal” is provided as a standard feature, as in previous models.
Features
■Analysis Chamber
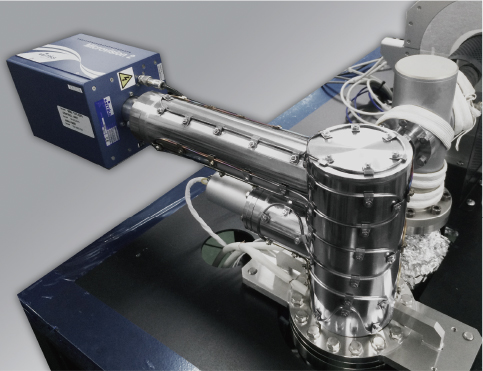
Two turbomolecular pumps in tandem reduce the hydrogen background, enabling high-sensitivity real-time hydrogen analysis.
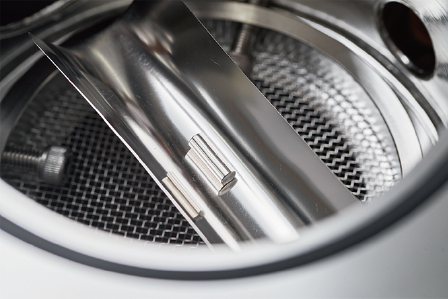
■Sample Heating Chamber
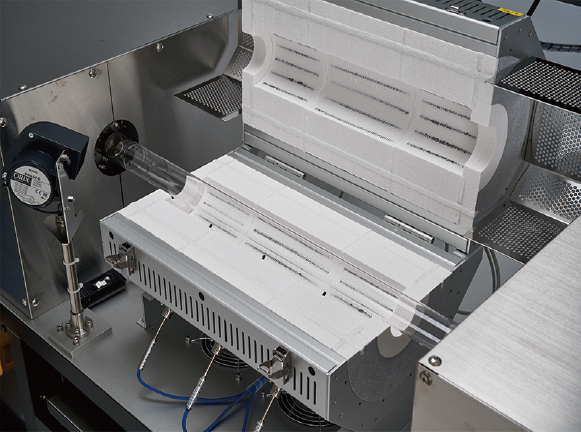
Utilizing an external heating furnace and a quartz core tube, the heating element produces no outgassing. The core tube is directly connected to the analysis chamber, achieving a
hydrogen background (hydrogen partial pressure) of 5.0E-9 Pa or less.
Designed compactly for small samples with uniform heating length up to 100 mm.
■Sample Loading Chamber ■Desiccator
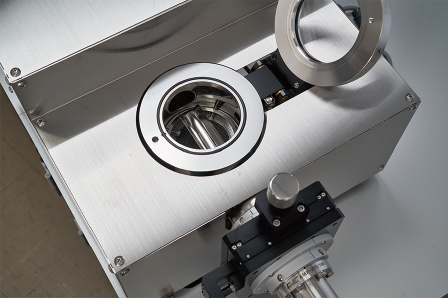
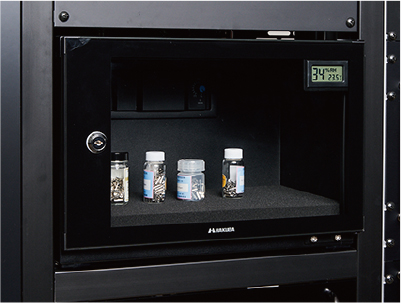
Samples can be replaced without exposing the analysis chamber or the heating core tube to
the atmosphere. The slidable sample chamber facilitates core tube replacement for maintenance.
Pump-down time for sample transfer is within 15 minutes. Actual samples measuring up to
Ø20 mm × 50 mm can be analyzed, excluding powders.
■Built-in Hydrogen Standard Leak System
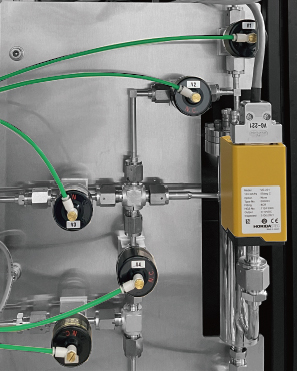
Hydrogen gas is automatically filled, and once each target pressure is reached, step-by-step operations ensure accurate quantitative standards, providing long-term, stable, and reliable measurement results.
■Pumping and Heating Control
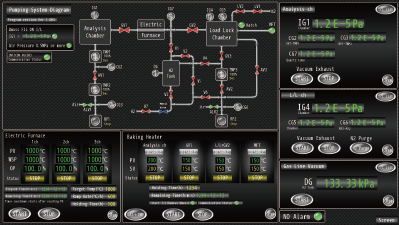
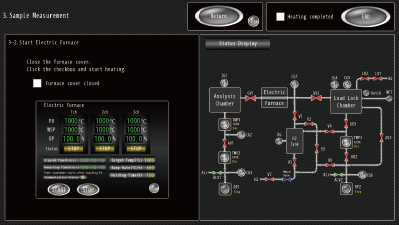
Pumping, venting, and heating settings can be easily operated. Standard leak gas introduction for
quantitative standards can also be performed automatically with a single click.
■“H2Cal” Hydrogen content calculation software
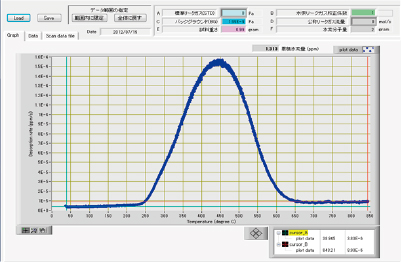
Our internally-developed hydrogen calculation software enables easy calculation of wt.ppm values.It is also possible to obtain wt.ppm hydrogen content data within a specified temperature range.
Measurement of Hydrogen Permeation in High-Strength Steel
by Cyclic Corrosion Test
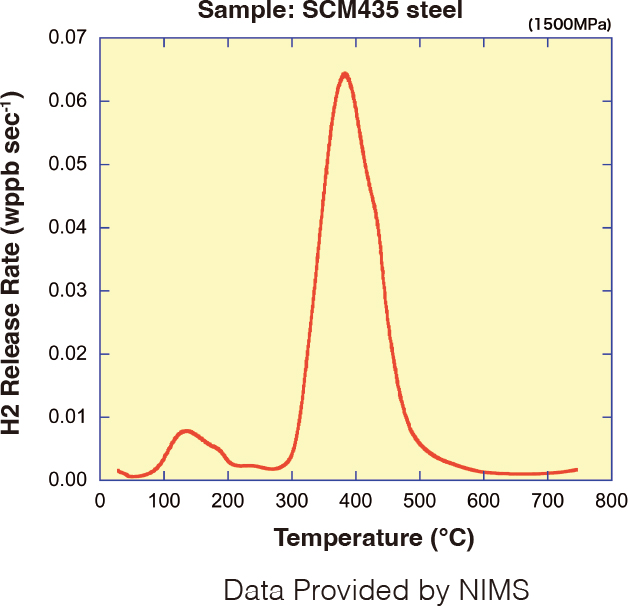
The sample evaluated in the graph is SCM435 steel (1500 MPa) after a cyclic corrosion test. A small peak on the low-temperature side is the permeated hydrogen due to corrosion reactions. This hydrogen, capable of diffusing at room temperature, is referred to as “diffusible hydrogen.” Since delayed fracture (hydrogen embrittlement) is caused by trace amounts of diffusible hydrogen at the ppm level, highly sensitive hydrogen concentration measurement is essential.
Standard Specifications
| Ultimate Vacuum | ≤ 5.0E-8 Pa |
| Analysis Chamber Exhaust Line | 280 L/s turbo molecular pump (tandem configuration) + backing pump |
| Hydrogen Background | ≤ 5.0E-9 Pa |
| Quantitative Analysis Sensitivity | 0.01 wt.ppm (based on 5g steel sample) |
| Standard Leak | Filling pressure controlled by absolute pressure transducer Calibration Flow Rate (atm·cc/s) H2 gas Filling Pressure (kPa) 9.24 E-6 atm・cc/s 5.00 kPa 4.61 E-5 atm・cc/s 25.00 kPa 1.42 E-5 atm・cc/s 75.00 kPa 1.91 E-4 atm・cc/s 100.00 kPa |
| Sample Heating Temperature | Room temperature to 1000℃ |
| Heating Rate | 50℃/hr~600℃/hr |
| Sample Size | Max. 20 mm × 50 mm |
| Furnace Tube Dimensions | OD=φ38㎜×750㎜ |
| Preparation Chamber Exhaust Line | 280 L/s turbo molecular pump + backing pump |
| Sample Introduction | Operated via a magnetic feedthrough under high vacuum |
| Hydrogen Qualitative Software Functions | The standard configuration comprises the hydrogen quantitative software “H2Cal”, a dedicated PC, monitor, and keyboard. Input of hydrogen quantitative reference values (sample weight, hydrogen background, and calibration flow rate) Display of hydrogen evolution rate and hydrogen quantity Display of hydrogen evolution spectrum (evolution rate vs. temperature graph) Display of hydrogen evolution spectra and hydrogen integrated quantity within the specified temperature range |